
Putting together a business plan for a multi-product eCommerce store can be a complicated job, but with the help of Artificial Intelligence (AI) you can automate a lot of the most tedious work. In this guide, I'll show you how to use a structured prompt to generate an automated Excel file, complete with linked sheets, accurate formulas and dummy data to test the system. We'll also go through the core math formulas, so you understand the financial analysis inside your mini business plan.
How to Structure the Prompt
To get the most out of AI, you need to structure your prompt clearly and in detail. A well-written prompt includes:
- Role: Define the AI's role (for example, a Google Sheets expert).
- Instructions: Spell out exactly what it needs to create.
- Rules: List the rules it must follow (such as entering formulas only and never doing calculations directly in the code).
- Steps: List the steps needed to complete the task.
- Output: Define the final output you expect (for example, an Excel file with linked sheets and working formulas).
The Prompt
Here's a sample prompt you can use to create an Excel file and adapt however you like. It's a very long prompt, but it's well structured, so it's easy to edit to fit your needs.
The Key Formulas in Your Mini Business Plan, Explained
Generating the Excel file is only half the job. You also want to understand the math behind the formulas it uses. Here's how the main formulas in your mini business plan work:
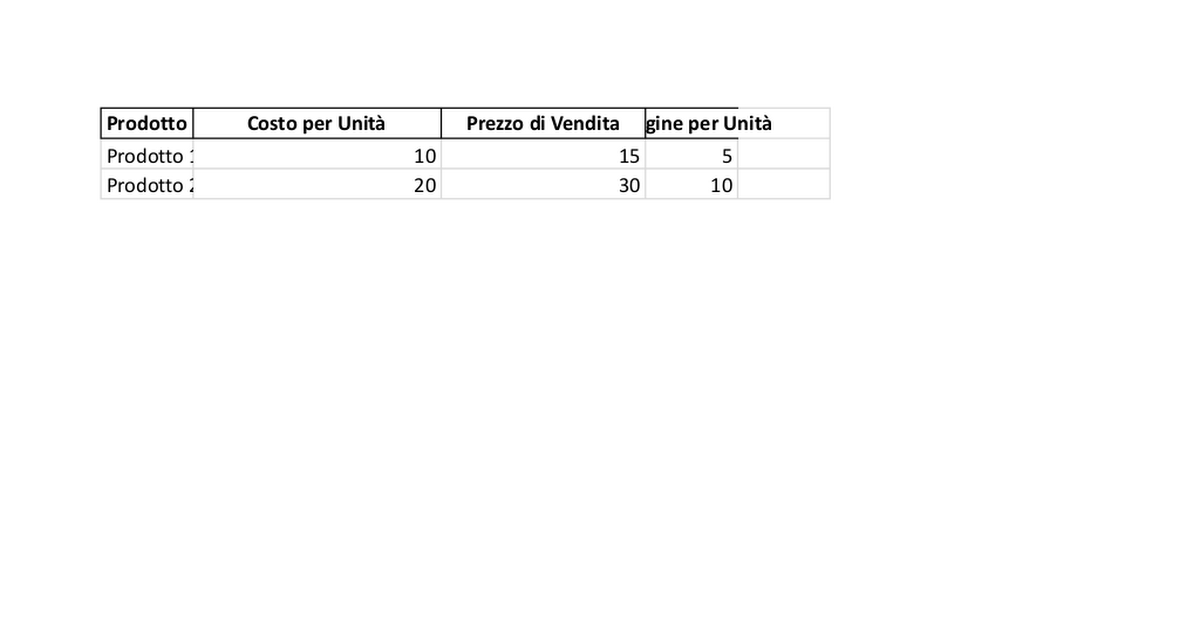
1. Unit Margin
Unit margin is the difference between a product's selling price and its cost per unit.
The formula is:
Unit Margin = Selling Price - Cost per Unit
Example: If a product sells for €15 and costs €10 per unit, the unit margin is €5.
2. Monthly Revenue
Monthly revenue for each product is the number of units sold multiplied by the selling price.
Monthly Revenue = Units Sold * Selling Price
Example: If you sell 100 units of a product priced at €15 each, your monthly revenue is €1,500.
3. Annual Revenue
Annual revenue for each product is the sum of its monthly revenue.
Annual Revenue = Sum(Monthly Revenue for every month)
Example: If a product's average monthly revenue is €1,500, its annual revenue is €18,000.
4. Total Cost of Goods Sold
To get the total cost of goods sold, multiply the cost per unit by the number of units sold, then add up the results for every product.
Total Cost of Goods Sold = Sum(Cost per Unit * Units Sold for every product)
In Google Sheets:
If your unit costs and units sold sit in two separate columns, you can use SUMPRODUCT:
=SUMPRODUCT('Product Catalog'!B2:B100, 'Sales Forecast'!C2:C100)
5. Gross Profit Margin
Gross profit margin is the difference between total revenue and the total cost of goods sold.
Gross Profit Margin = Total Revenue - Total Cost of Goods Sold
Example: If total revenue is €18,000 and the total cost of goods sold is €10,000, the gross profit margin is €8,000.
6. Break-Even Point
The break-even point is the number of units you need to sell to cover your fixed costs.
Break-Even Point = Fixed Costs / (Selling Price - Variable Cost per Unit)
Example: If fixed costs are €10,000, the selling price is €15 and the variable cost per unit is €10, the break-even point is 2,000 units.
Generating the Code with AI
The model will generate Python code that creates an XLS file, a format for storing data in tables, including spreadsheets, charts, tables and math formulas. It's the file type tied to Microsoft Excel, one of the most widely used spreadsheet programs, and it works with any tool that supports the format.
So what do you do with this code if you're not a programmer? You have two options:
- Tools that can run code: some AI models, like ChatGPT with Code Interpreter, can run the Python code directly and generate the file. If you're using one of these tools, you get a ready-to-use file with no extra steps.
If your tool can't run code, you can use an external development environment like Google Colab or Jupyter Notebook to run the Python code and generate the Excel file.
- Google Colab: A cloud-based development environment that lets you run Python code right in your browser. Paste the code into a Colab notebook and run it to get your Excel file.
- Jupyter Notebook: If you'd rather work locally, you can use Jupyter Notebook to run the Python code and generate the Excel file on your computer.
How to Import an Excel File into Google Sheets
Once you've generated an Excel (XLS) file with the Python code, you can import it into Google Sheets to view it, edit it and dig further into the numbers. Here's how:
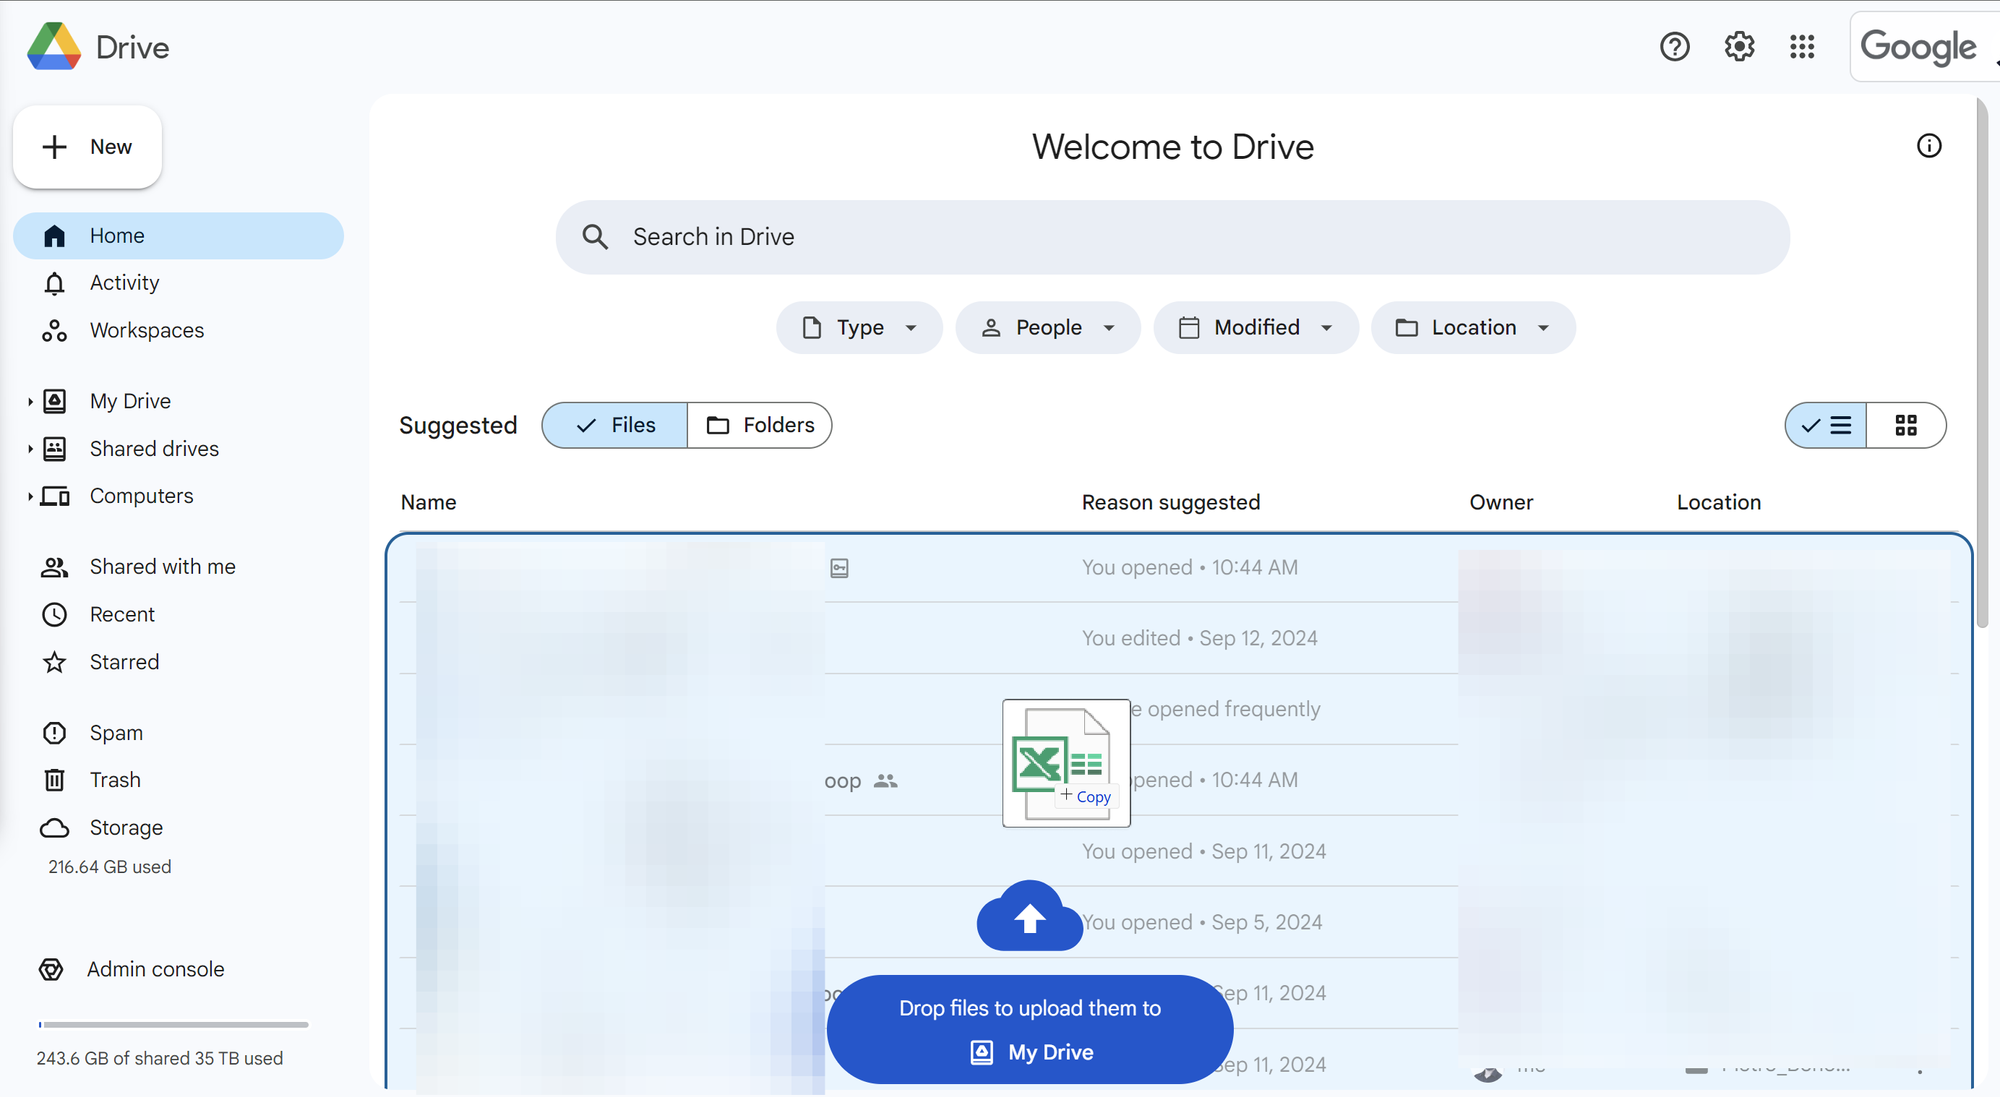
1. Go to Google Drive
To start, sign in to your Google account and go to Google Drive. Google Drive is Google's cloud storage service, where you can upload and manage all your files, Excel files included.

2. Upload the Excel File
Once you're in Google Drive, you can upload the Excel (XLS) file you generated:
- Drag and drop: Drag the Excel file from your computer and drop it into the Google Drive window. The upload starts automatically.
- Manual upload: Or click the "New" button in the top left, select "File upload" and pick the Excel file from your computer.
3. Open the File with Google Sheets
After uploading the Excel file to Google Drive, open it with Google Sheets:
- Find the uploaded Excel file in your Google Drive file list.
- Double-click the file to open it. Google Sheets opens it automatically in a new tab.
4. Start Working on Your File
Now that the file is open in Google Sheets, you can start editing it. All the formulas and data from the Excel file carry over, and you can keep working on it just like any other Google spreadsheet.
Creating an Executive Summary and a Break-Even Chart with AI
Introduction
In this chapter, we'll look at how to use an AI model to analyze an Excel file with financial and sales data, so it produces an executive summary and a chart that highlights the financial break-even point. We'll follow a structured process to make sure the AI reads all the data correctly, calculates the values it needs accurately and gives you a useful, informative output.
What to do
- Upload the file to the tool
- Copy and paste the prompt
- Work with the AI
- Get the result
- Copy and paste the executive summary and the chart into the "Business Summary" sheet of your Excel file.
The Final Result You Should Get
When the AI runs this prompt correctly, you should get two main outputs:
An Executive Summary
Executive Summary: Analysis of the Excel File Results
1. Data Overview: The Excel file gives a detailed view of the sales forecast, the related costs and the break-even point for an eCommerce business. The main data analyzed is:
Sales Forecast: Projected monthly sales for each product, with total annual revenue of €57,450.
Financial Analysis:
Total Cost of Goods Sold: €26,600
Gross Profit Margin: €16,900
Total Revenue: €57,450
Break-Even Analysis:
Fixed Costs: €10,000
Average Variable Cost per Unit: €15.00
Average Selling Price per Unit: €22.50
Break-Even Point: 1,333 units sold (about €29,992 in cumulative revenue).
2. Revenue and Cost Analysis: We analyzed how cumulative revenue and costs moved over the year. Cumulative revenue overtook cumulative costs in August, which means the business hit its break-even point that month.
Cumulative revenue in August: €30,600
Cumulative costs in August: €29,992
3. Pinpointing the Break-Even Point: The business broke even in August, when cumulative revenue reached €30,600 and passed cumulative costs of €29,992. That's the moment the business started turning a net profit.
4. Strategic Implications:
Profitability: The business became profitable in August, a key milestone for its long-term viability.
Cost Management: A precise understanding of variable and fixed costs made it possible to pin down the exact break-even moment, and it shows why tight cost control matters.
Financial Planning: Breaking even in August is a chance to revisit the forecasts and adjust strategy to improve profitability in the following months.
5. Recommendations:
Ongoing Monitoring: Keep tracking monthly costs and revenue to make sure the business stays above its break-even point.
Cost Reduction: Look at ways to cut variable costs or improve profit margins, which could bring the break-even point forward in the future.
Sales Strategy: Step up marketing to drive more sales in the early months and make the business more financially stable.
This document gives a clear, concise summary of the data in the Excel file. The executive summary explains why the chart matters, which key factors drove revenue and costs, and highlights the break-even point as a turning point for the business.
A Chart
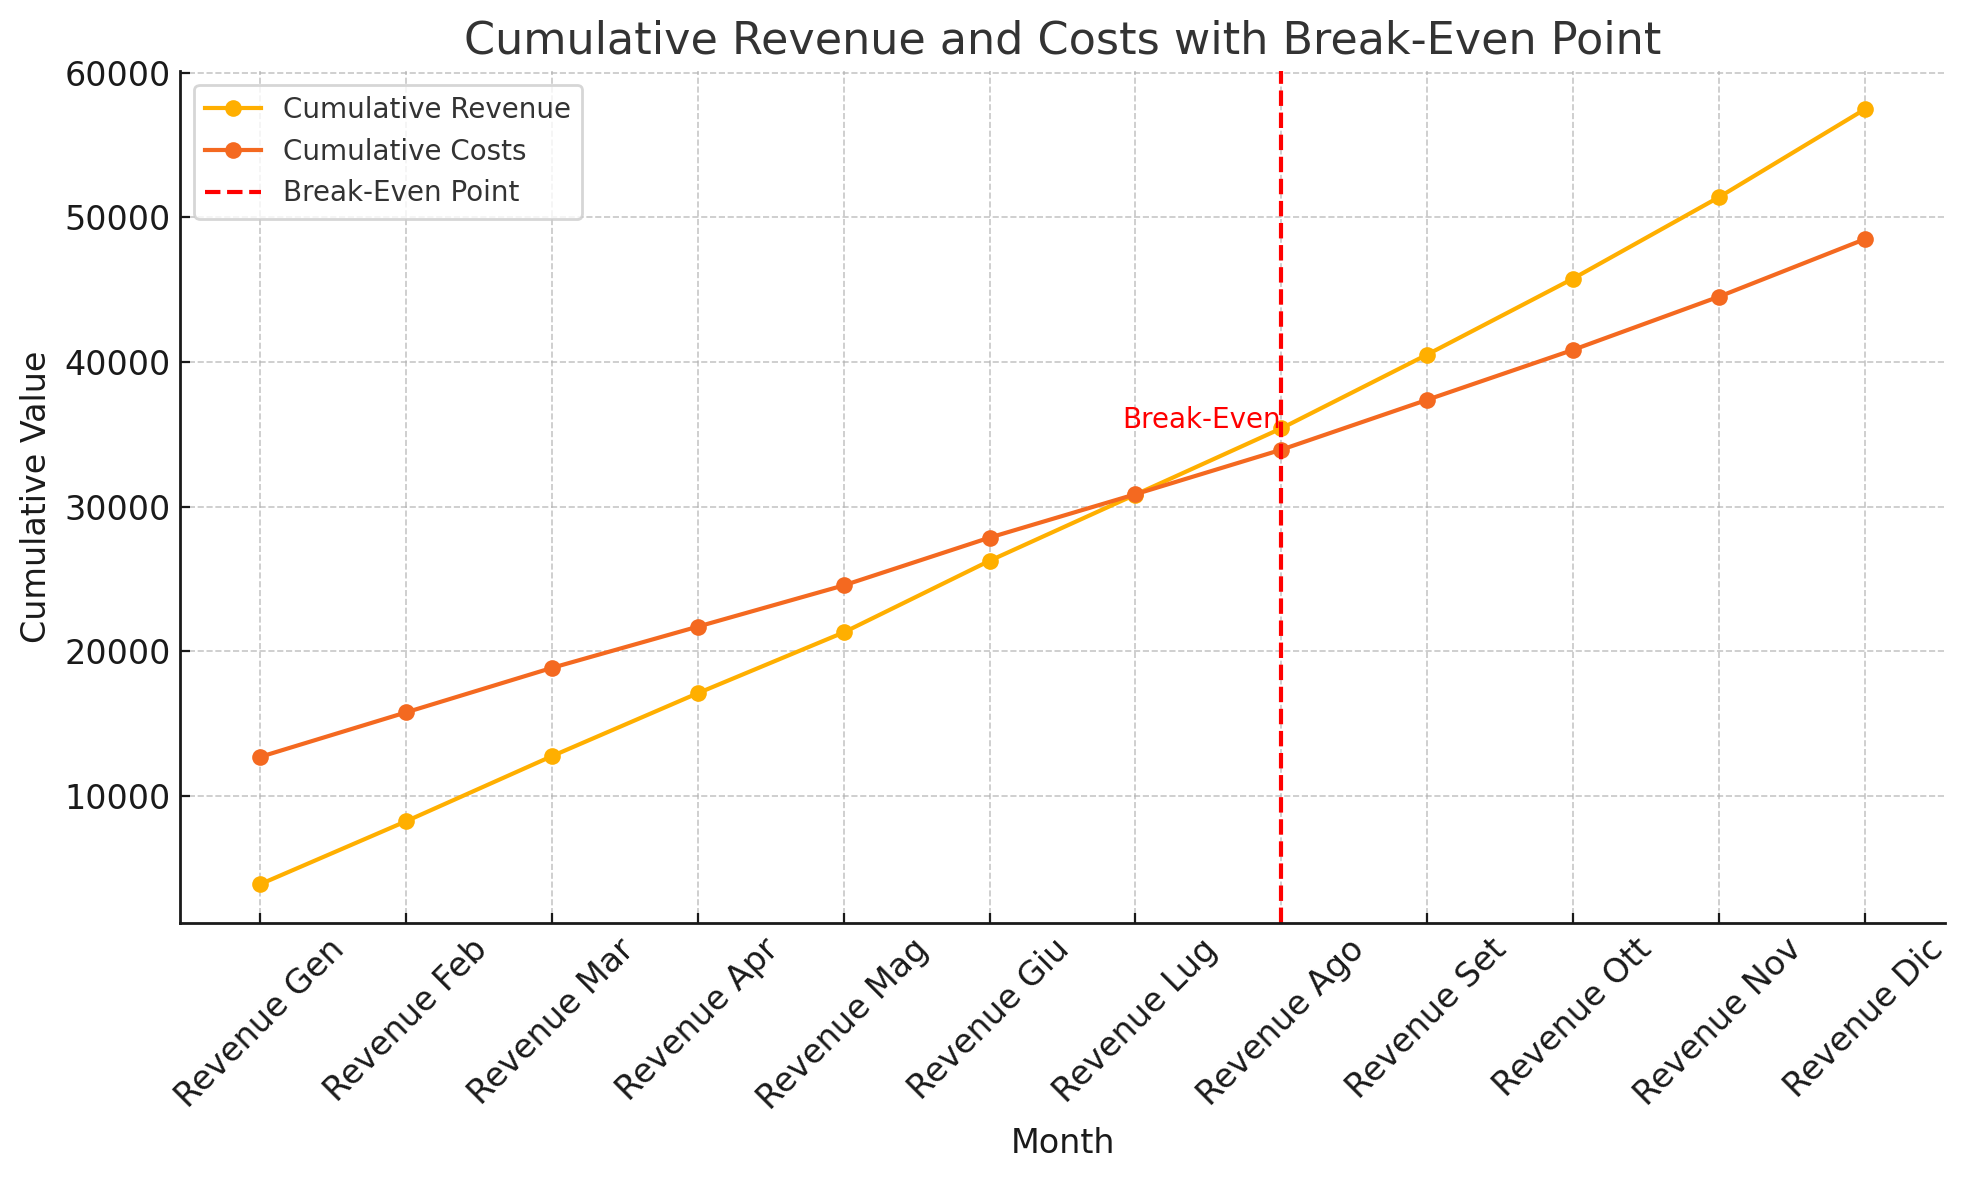
This chart shows cumulative revenue and costs month by month. The break-even point is clearly marked, usually with a vertical line or a symbol showing the moment cumulative revenue and cumulative costs are equal.
An important note
Even with well-structured, precise prompts, today's AI doesn't always get the answer right, so you may need a few rounds of iterating, checking and fixing. Still, it will speed up the work a lot, and these systems are improving so fast that before long they may stop making mistakes altogether. To keep up with new developments and improvements, you can follow our intelligence section or sign up for Marketing Hackers.
If you found this useful, help us grow. The goal is to become a big community hungry for knowledge, so we can ask companies for discounts, early access, event invitations, funding to keep the project running and perks for members of Marketing Hackers, which will always be free.
The more of us there are, the more we'll get. So if you like the project, share it with your colleagues and friends and invite them to sign up so the knowledge spreads and nobody gets left behind.
Stay Tuned!
Useful Links

 Pietro Bonomo









Cosa ottieni iscrivendoti:
- Accesso a tutti gli episodi della newsletter
- Guide e corsi completi sull'AI per marketer
- Strumenti AI professionali (BrandPix, Short Video Suite)
- Crediti gratuiti per iniziare subito