B2B Ad Benchmarks in Italy: LinkedIn, Google and Lead Gen Channels
There are no official CPC or cost-per-lead benchmarks for B2B ads in Italy. Here are sources you can verify and a method to build your own baseline.
A twelve-person industrial automation firm puts €2,000 into LinkedIn in a month and gets fourteen leads back. The owner looks at the report and wonders whether €143 a lead is expensive. They go looking for an Italian benchmark and find CPC and cost-per-lead ranges that shift from one site to the next. None of them mention a sample, a time period or a method.
Here’s the awkward truth before we go any further. Italy has no official, public benchmark for B2B CPC, CPM or cost per lead. The figures doing the rounds almost always come from US samples quoted in dollars, or from “internal data” nobody can check. This guide sticks to numbers you can verify and gives you a method for building your own reference point. When you’re setting a budget for a small or mid-sized business, that reference point is worth more than any national average.
Where a number comes from matters before what it says
Whenever a benchmark lands in front of you, work out which of these three families it belongs to.
- Market data from research firms. It tells you how much gets spent and where. On the cost of a lead it has nothing to say.
- Mechanics the platforms publish: how the auction works, how daily budgets behave, how bidding strategies operate. You can check all of it in Google’s and LinkedIn’s official documentation.
- Data from your own ad account and CRM. This is the only family that describes your market, your offer and your sales team.
The first two give you context. The number that tells you whether a campaign pays its way comes from the third, and hardly any small business works it out. The rest of this article follows that order, and it’s part of our series on digital advertising benchmarks in Italy.
Where marketing budgets actually go

Every year Gartner surveys marketing leaders at North American and European companies. In the 2025 edition, marketing budgets were stuck at 7% of revenue1. Across the 402 CMOs surveyed in February and March 2025, digital channels made up 61.1% of total spend, and paid channels 69% of digital spend. Paid search edged up from 13.6% to 13.9% of digital, display sat at 12.5% after growing 17% in a year, social advertising held at 12.2% and email accounted for 7.4%2.
The sample is CMOs and marketing leaders from North America, the UK and Europe, and no €1.2M Italian business thinks like a CMO in London. The proportions still work as a reality check. Here’s what they look like applied to a company turning over €1.2 million.
| Line item | Gartner share | Annual value on €1.2M |
|---|---|---|
| Marketing budget | 7% of revenue | €84,000 |
| Of which digital | 61.1% | €51,324 |
| Paid digital | 69% of digital | €35,414 |
| Paid search | 13.9% of digital | €7,134 |
| Social advertising | 12.2% of digital | €6,262 |
| Display | 12.5% of digital | €6,416 |
| 7.4% of digital | €3,798 |
That works out at roughly €600 a month on paid search and €520 on social. If you’re spending far more than that on LinkedIn and complaining about your CPL, or far less and expecting a steady stream of enquiries, this is the first sum to run. The table shows you how far you sit from an average split and makes you justify the gap. How much you actually spend is still your call.
How much does a B2B lead cost in Italy?
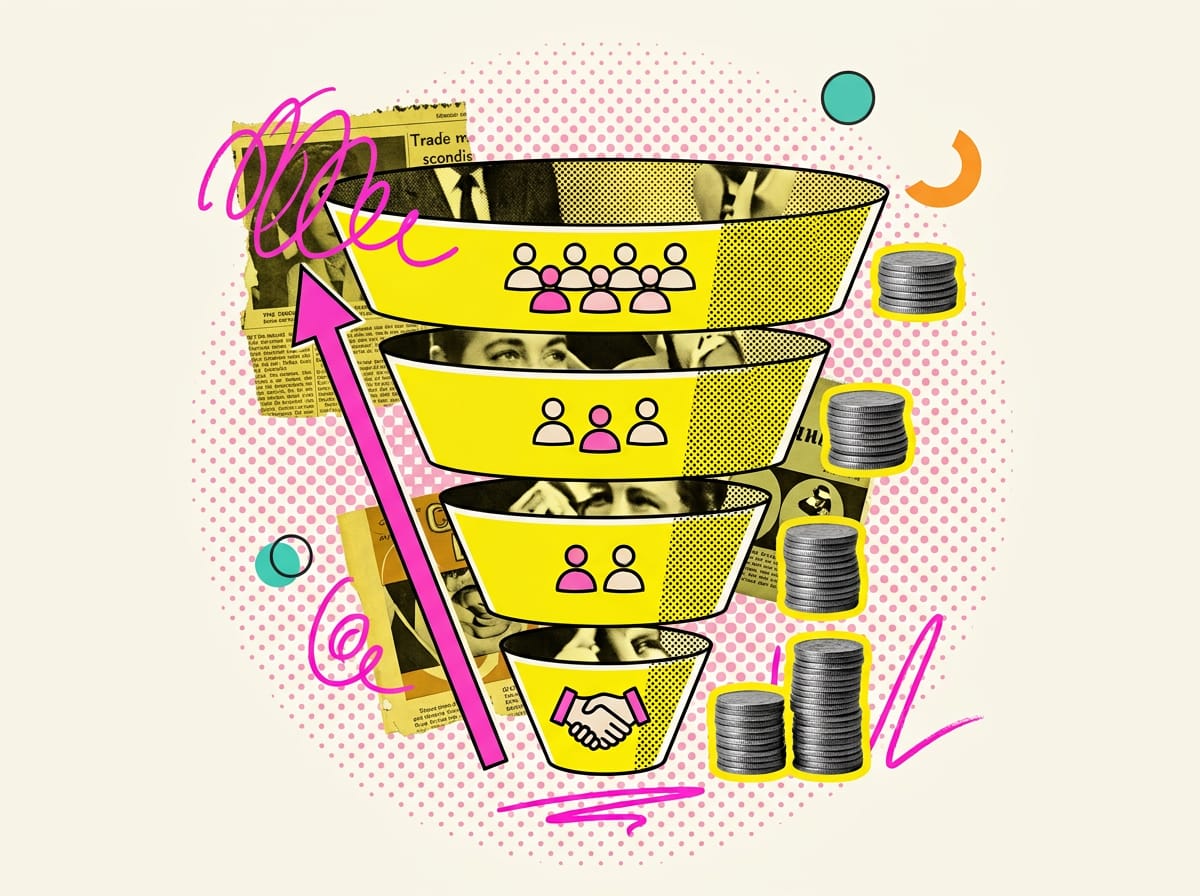
It depends on what a customer is worth and how many leads turn into contracts. You work out a sustainable cost per lead backwards: start from first-year margin, decide what share of it you’re willing to spend winning a customer, then apply the lead-to-MQL, MQL-to-SQL and SQL-to-contract rates from your CRM. That gives you a hard ceiling.
Take an example. A company sells a plant maintenance service at €12,000 a year with a 40% gross margin, so each new customer brings in €4,800 of margin in year one. The owner decides to spend no more than 30% of that to win them, which is €1,440. That’s the maximum CPA, the cost per acquired customer above which every contract loses money.
Here are the conversion rates from the last twelve months in their CRM. They belong to this company, so keep them apart from market averages.
| Stage | Conversion rate to next stage | Maximum sustainable cost |
|---|---|---|
| Customer | €1,440 | |
| SQL (opportunity accepted by sales) | 25% become customers | €360 |
| MQL (in-target lead with a real need) | 30% become SQLs | €108 |
| Raw lead | 40% become MQLs | €43.20 |
The cost-per-lead ceiling is €43.20. If LinkedIn brings you leads at €60, the channel only works if those leads convert to MQL at better than 40%. If Google brings them in at €35 but only one in ten is in target, you’re paying €350 per MQL, more than three times what you can afford.
That’s why the “average B2B CPA” so many people search for is close to useless. Two firms in neighbouring units on the same industrial estate, one selling €3,000 contracts and the other €80,000 projects, can have sustainable CPAs twenty times apart and both be doing a great job. If customers stay three or four years the maths shifts again, because the margin to use is the whole relationship’s. Subscription businesses think this way, which is why their SaaS benchmark has a different threshold.
Let AI do the maths, starting from your own data
Export a CSV from your CRM with one row per lead (creation date, source, stage reached, contract value if closed), open it in Google Sheets and upload the file to Claude or ChatGPT with this prompt.
You are a B2B marketing analyst. Attached is our CRM export for the last 12 months.
Each row is a lead with: creation date, source (LinkedIn Ads, Google Ads, organic, referral, trade show),
furthest stage reached (lead, MQL, SQL, customer, lost), annual contract value.

1. For each source, calculate the lead→MQL, MQL→SQL and SQL→customer conversion rates.
2. Our average gross margin is 40% and we want to spend no more than 30%
   of first-year margin to acquire a customer. Calculate the maximum CPA
   and work back to the maximum sustainable cost per SQL, MQL and lead, separately for each source.
3. Flag any source with fewer than 30 leads: the rates for those are not reliable.
4. Return a table and three lines of practical commentary, with no generic statements.
Step 3 is the one that saves you from bad calls. With twelve leads from a source, a single contract more or less flips every conclusion.
LinkedIn Ads B2B benchmarks: what the research says

LinkedIn costs more for a simple reason. The auction runs on narrow audiences defined by job title, industry and company size, and everyone selling to the same people is bidding on them. If you’re after procurement managers at Lombardy manufacturers with more than fifty staff, you’re fishing in a pond of a few thousand profiles, up against software vendors, consultants and banks.
A 2025 study by researchers from three Ukrainian universities interviewed 25 industrial marketing professionals: 14 from mid-sized firms with 50 to 250 employees and 11 from large companies with over a thousand. On average they put 32% of their digital budget into LinkedIn Ads. CPC and cost per lead often run higher than on other social platforms, and in return the leads are better qualified, with conversion rates between 5% and 9%. Targeting by job title, industry and company size does the most to cut wasted contacts, and the best practices respondents named were dedicated landing pages, continuous A/B testing and retargeting3.
The sample is small and it isn’t Italian. Treat it as confirmation of a pattern and don’t lift targets from it. The core message holds up, though. On LinkedIn you pay more per contact and earn it back if your sales team turns those contacts into opportunities more often than on other channels. If your CRM doesn’t show that happening, a high CPC is just a cost.
Lead Gen Forms or landing pages: the trade-off nobody measures
LinkedIn’s native form arrives pre-filled with name, company and job title, and it takes one tap to submit. That’s convenient for the person filling it in, and it lowers the bar for intent. You get more leads, and some of them clicked almost on reflex. A landing page asks for a bit more effort and filters harder. It brings fewer leads, and more of them are in target.
The Lead Gen Form conversion rates you see quoted online disagree with each other and are rarely documented. Measure them yourself, on your own audience. Run the same offer to the same audience in both versions for six to eight weeks, then compare them on cost per SQL. A native form with a €50 CPL and 15% of leads becoming MQLs costs you €333 per MQL. A landing page with a €90 CPL and 45% MQLs costs you €200.
Your first LinkedIn benchmark in three steps
- Export 90 days of data from Campaign Manager, broken down by campaign and audience (spend, impressions, clicks, leads).
- Match every lead against your CRM and note the furthest stage it reached. You’ll need a shared identifier, usually the work email address.
- For each audience, calculate CPM, CPC, CTR, cost per lead, cost per MQL and cost per SQL, and put them next to the ceiling you worked out from margin.
That’s your LinkedIn B2B benchmark, the only one that genuinely describes your market. For step three you can upload both files to Claude with a prompt along these lines.
Attached are two files: the LinkedIn Campaign Manager export (90 days, by audience)
and the CRM export with lead email and stage reached. Join the files on email.
For each audience, calculate CPM, CPC, CTR, CPL, cost per MQL and cost per SQL.
Our maximum sustainable cost per SQL is €360.
Rank the audiences from most to least efficient on cost per SQL and, for the worst ones,
say whether the problem is upstream (low CTR, high CPC) or downstream
(lots of leads, few MQLs).
Once the table works, hook it up to Looker Studio through a Google Sheet you refresh every month. The comparison then comes down to a twenty-minute meeting.
Google Ads for B2B: search versus latent demand
On the Search Network you pay for intent
Search Network ads show up for people already looking online for your products or services. Keywords tie the ad to those searches, and Google pushes you to pair broad match with Smart Bidding, which sets bids automatically based on your conversion goals4. With cost-per-click bidding you set a maximum CPC and control spend through your average daily budget. A campaign’s monthly limit is that budget multiplied by the average number of days in a month5.
In Italian B2B, volumes are often tiny. A query like “contract CNC turning Brescia” might get very few searches, but whoever types it has a technical drawing ready to send. Few clicks, lots of intent. Leads here often cost more than you expected and close more often than you expected, and cost per SQL is what tells you whether it’s worth it.
There’s another reason to cover search even when discovery happens elsewhere. In an Ipsos survey commissioned by Google of 12,594 adult online shoppers (December 2025), 67% of people who discover a brand on social media are then nudged by Google results into buying a different one6. The sample is consumers and the client has a stake in the answer, so handle it with care. The pattern still applies to a B2B buyer who sees your LinkedIn post and then searches for the category on Google. If you’re not there, they find a competitor. For a detailed look at Search Network costs, see the Google Ads Italy benchmark.
Performance Max for people who aren’t searching yet
Demand campaigns go after people who have the problem and aren’t yet looking for a fix. Performance Max pulls all of Google’s inventory into a single campaign: Search, YouTube, Display, Discover, Gmail and Maps. You set conversion goals, give each one a value, and feed in signals about the audience segments that convert best7.
For a B2B company the risk is real. If the only conversion you declare is “form submitted”, the algorithm finds the people who fill in forms most readily: students, curious competitors, suppliers hunting for customers. The fix comes from Google’s own logic. Give the generic form a low value and give a quote request, or a contact your sales team qualifies, a much higher one. A campaign that optimises for value learns to go after the latter.
Reading search and demand in the same account
Comparing the CPL of a Search campaign with a Performance Max campaign is like comparing the cost of a customer who walked into your shop with the cost of a leaflet drop. The two campaigns do different jobs. To keep them in one picture you need three rules:
- label each campaign by its role (existing demand or latent demand) and only compare campaigns with the same role;
- measure cost per SQL over a 60-90 day window, because a contact YouTube generates in March can become an opportunity in June;
- check whether searches for your brand rise in the months your demand campaigns are running.
A case study of a Singapore SaaS company (given the pseudonym Emplorax) found that SEO and Google Ads delivered the lowest cost per lead and the highest number of leads, while Meta Ads contributed least to pipeline quality8. It’s one case, in a different market. It does show nicely how the channel rankings change once you stop counting contacts and start judging their quality, something we come back to in our Google vs Meta comparison.
B2B channels compared by role
The table has no cost figures, because there are no reliable ones for Italy. Each row gives the channel’s job and the metric to judge it by.
| Channel | Job in the funnel | Deciding metric | What the sources say |
|---|---|---|---|
| LinkedIn Ads | Reach specific roles and companies | Cost per SQL | Higher CPC and CPL than other social platforms, better-qualified leads3 |
| Google Search | Capture existing demand | Cost per SQL, share of searches covered | Ads shown to people actively searching4 |
| Performance Max | Create demand among people not searching | Cost per MQL with conversion values | All Google inventory in one campaign7 |
| Nurture contacts you already have | Conversion to SQL | 179 leads in two years for a Nordic B2B startup9 | |
| SEO | Existing demand, no cost per click | Qualified organic leads | Among the lowest CPLs in the Emplorax case8 |
| Meta Ads | Broad audiences, retargeting | Pipeline quality | Smallest contribution to pipeline in the Emplorax case8 |
The Nordic startup is a useful case. In a 2015-2016 action research project, email marketing produced 179 leads, while social and SEO generated no actual contacts. They did, however, improve the company’s other digital activity9. A channel with zero direct leads can still be working for the others. That’s why you judge the channel mix as a whole, over several months: a single week tells you far too little.
B2B also runs at its own pace. An e-commerce store or a local services business often closes in a few days. In B2B the cycle is measured in months, and several people have a say in the decision.
Read the B2B funnel in months
Research from the Università Cattolica, published in 2026 in the journal Piccola Impresa/Small Business, drew on 20 semi-structured interviews with experts, Italian B2B SMEs and agencies. It identifies three strategic factors in lead generation (marketing strategy, lead-centred value creation, digital culture) and three operational ones (integrated management of physical and digital channels, digital integration, marketing and sales alignment). The author notes that SMEs still treat lead generation mainly as a sales activity, despite the role marketing plays in finding and nurturing valuable contacts10.
In practice, the most useful benchmark you can have is an MQL definition written down and signed off by both marketing and sales. If sales only counts a lead as “good” once it asks for a quote, while marketing counts anyone who downloads a spec sheet as an MQL, the conversion rates in your CRM are made up, and so is your cost-per-lead ceiling. Simon Hall, author of B2B Digital Marketing Strategy, puts campaign tracking and use of data among the central challenges of B2B digital marketing11. Without a shared definition, neither one works.
The second tool is cohort analysis. Take every lead from April and see where they stand at 30, 60 and 90 days. If at 90 days half the LinkedIn leads are still “under evaluation” while the Google ones have already closed or dropped out, the two channels run on different cycles, and judging them on the same month will have you cutting the wrong one.
To keep qualification clean, you can have AI classify the notes your sales team writes after the first call. You write the criteria, and Claude or ChatGPT applies them consistently.
Below are the first-contact notes for 40 leads. Our MQL meets all of these criteria:
manufacturing company with 20 to 250 employees, based in Northern Italy, needs scheduled
maintenance within 6 months, contact has signing authority or direct influence on the purchase.
For each lead, reply with: MQL yes/no, missing criterion if no, one line of reasoning.
Do not infer information that is not in the notes: if a detail is missing, write "to be checked".
The last line of the prompt stops the model “filling in the gaps” and inflating your MQL count. A person still needs to review the output, but that review takes ten minutes where doing it by hand would eat an afternoon.
How much does a LinkedIn Ads click cost in Italy?
There’s no official figure for Italy. The numbers floating around don’t state a sample or a period. The available research only confirms that CPC and cost per lead on LinkedIn often run higher than on other social platforms3. The number that matters is yours, calculated over at least 90 days and per audience.
What’s the average B2B CPA?
There’s no useful average, because a sustainable CPA depends on contract value and margin. Work it out as a share of first-year margin (in the example above, 30% of €4,800, so €1,440) and work back from there to your maximum cost per SQL, MQL and lead.
What budget should I start with on Google Ads?
Google doesn’t set a price list. You choose an average daily budget, and the campaign’s monthly limit is that figure multiplied by the average number of days in a month5. For a B2B small business, the practical rule is to buy enough clicks to reach at least 30 leads in three months, the threshold below which conversion rates aren’t reliable.
Is LinkedIn worth it for a business turning over a million?
It’s worth it when a customer is valuable enough to absorb a cost per SQL of a few hundred euros, and when the decision-makers you need to reach can be defined by role and industry. If you sell €2,000 contracts to a broad audience, search ads and email to the contacts you already have usually pay off better.
Further reading
Sources
Footnotes
-
Gartner 2025 CMO spend survey reveals marketing budgets have flatlined at seven percent of overall company revenue. gartner.com ↩
-
Gartner survey finds digital channels account for 61.1% of total marketing spend. gartner.com ↩
-
LinkedIn as a key tool for targeted advertising in industrial B2B marketing. [ecdev.com.ua](https://ecdev.com.ua/web/uploads/pdf/Economics of Development_2025_Vol. 24_No_2-113-121.pdf) ↩ ↩2 ↩3
-
Rete di ricerca. business.google.com ↩ ↩2
-
Costo. business.google.com ↩ ↩2
-
Google Ads. business.google.com ↩
-
Performance Max. business.google.com ↩ ↩2
-
PROPOSED DIGITAL MARKETING STRATEGY FOR LEAD GENERATION IN B2B SAAS INDUSTRY: (A CASE STUDY OF EMPLORAX IN SINGAPORE). radjapublika.com ↩ ↩2 ↩3
-
Optimization of Digital Lead Generation Channels : Case: a Startup Nordic company’s entry into the B2B market. theseus.fi ↩ ↩2
-
Key critical aspects of SMEs in B2B Lead generation: insights from an Italian qualitative study. journals.uniurb.it ↩
-
B2B Digital Marketing Strategy: How to Use New Frameworks and Models to Achieve Growth. play.google.com ↩
FAQ
Is there an official B2B cost-per-lead benchmark for Italy?
No. Nobody publishes an official benchmark for CPC, CPM or cost per lead in Italian B2B, and the ad platforms don't release averages by country and industry. The numbers you see quoted online almost always come from US samples priced in dollars, or from internal data no one can check.
Is €143 per lead on LinkedIn too much for a B2B SME?
It depends on your market, your offer and how many of those leads turn into customers. Without a reliable Italian benchmark, the right baseline comes from your own ad account and CRM data, not from generic averages found online.
How much should a B2B company spend on marketing as a percentage of revenue?
Gartner's 2025 CMO Spend Survey puts the average marketing budget at 7% of revenue. For a company turning over €1.2 million, that's roughly €84,000 a year. The sample is made up of large companies, though, so use the figure only as a sanity check.
How should you split your budget between Google Ads, social and other digital channels?
In Gartner's 2025 data, digital channels account for 61.1% of marketing spend. Within digital, paid search takes 13.9%, display 12.5%, paid social 12.2% and email 7.4%. For a €1.2 million company, that works out to about €600 a month on paid search and €520 on social.
Which data should you use to judge whether a B2B campaign is working?
Market data and platform documentation give you context, but the number that tells you whether a campaign pays off comes from your ad account and your CRM. They're the only data that actually reflect your market, your offer and the work your sales team does.