Marketing Funnel Optimization: TOFU, MOFU, BOFU Rates and A/B Tests
Marketing funnel optimization: calculate your TOFU, MOFU and BOFU rates, pick the stage to fix first and run reliable A/B tests on your conversion rate.

A window and door company gets 4,000 visits a month to its website. Those visits turn into 80 leads, 20 quote requests and 8 signed contracts. The owner wants 12 contracts by summer and can afford to change one thing at a time. In the meeting, the salesperson asks for a shorter form, the designer wants to rebuild the homepage, and the consultant keeps pushing follow-up emails. All three ideas are reasonable, and nobody has a number to back theirs up.
Marketing funnel optimization is how you end meetings like this one with data on the table. You already know the three stages. This piece covers which one to fix first, how to set up an A/B test you can trust, and how to turn the whole thing into a procedure a team member can run without you.
Ron Kohavi and his colleagues at Microsoft wrote a practical guide to online experiments. In it they call the opinion of the highest-paid person in the room the HiPPO, and they report that, in their experience, learning and return on investment come when teams listen to customers instead of the HiPPO.1 In a small business, the HiPPO is often you. That’s fine, as long as your ideas go through a test before they become the new version of the site.
Funnel conversion rate is made of three numbers

Funnel conversion rate is what you get when you multiply the pass-through rates between stages. For the window company it’s 0.2%, or 8 customers per 4,000 visits, and it comes from three rates multiplied together. When one of them drops, the end result drops with it, even if the other two hold steady.
| Stage | Step measured | This month’s numbers | Rate |
|---|---|---|---|
| TOFU | visit → lead | 4,000 → 80 | 2% |
| MOFU | lead → quote request | 80 → 20 | 25% |
| BOFU | request → customer | 20 → 8 | 40% |
Looking only at the overall 0.2% is like checking your bank balance without reading the statement. You can see money’s missing, but you have no idea where it went.
The multiplication has a practical consequence. Say you improve MOFU alone by 25%. Lead→request goes from 25% to 31.25%, the 80 leads become 25 requests and, at the same 40% close rate, customers rise to 10. Now picture spreading the same effort across two stages and getting +5% on each. The math is 8 × 1.05 × 1.05, which comes to 8.8 customers. One decisive push in one place beats two scattered tweaks. That’s why conversion rate optimization (CRO) on an acquisition funnel always starts with picking priorities.
Cost per lead, time to close and average contract value are still funnel metrics worth watching. To decide where to test, though, these three rates are all you need, calculated every month the same way.
Where should you start?
Start with the stage that has slipped furthest from your best months, as long as it has enough volume to measure. In a multiplicative chain, a 20% lift counts the same wherever it lands. What decides it is how much you can win back, what the change costs, and how much data you can collect.
The method has three steps.
- Calculate the three rates month by month for the last 12 months. Pull visits from Google Analytics 4 and leads, requests and contracts from your CRM. If leads and customers live in two separate Excel files, merging them is job one.
- Compare each rate with your own history. The industry benchmarks floating around online lump together e-commerce, software and services, and they rarely say where they come from. Your best quarter is a more honest yardstick. It reflects your pricing, your market and your salesperson.
- Put a euro figure on the recovery. Here’s an example. A contract is worth €5,000 in margin on average, and in the best months MOFU hit 32%. Getting back there means 25.6 requests, 10.2 customers and roughly €11,000 more margin per month. If TOFU peaked at 2.2% in its best month, recovering that level is worth 0.8 customers, or €4,000. At that point the priority is obvious.
When two stages are worth the same, start with the one closest to revenue. A change to the quote page shows up in contracts within a few weeks, while a better TOFU article reaches sales months later. The catch is volume. With 20 requests a month, a classic A/B test on BOFU never reaches a verdict, and that’s where you need methods built for low traffic.
How to set up an A/B test that tells the truth

On Monday the salesperson changes the landing page headline. By Friday there are 24 leads instead of 18, and the new version stays live forever. That’s a clue at best, and a weak one. Maybe a campaign launched that week, or it rained for five days straight and people went looking for new windows.
A controlled experiment splits visitors at random into two groups, shows each group one version and compares the results. Kohavi and colleagues consider it the best scientific design for establishing cause and effect between a change and user behavior. In the guide they spend a lot of time on statistical power, sample size and variance reduction techniques.1 For a small business, the upshot is that a test is only as good as the prep behind it. And the prep comes down to four steps.
Write the hypothesis before the test
Always use the same format.
If we change X for audience Y, metric Z goes up because W.
Here’s one for the window company. If we add three photos of finished jobs in the visitor’s own province to the quote page, quote requests from Google Ads visitors go up, because the visitor sees projects close to home and stops wondering whether the company covers their area.
Writing down the “because” forces you to spell out what you believe about the customer. If the test loses, you learn that reason matters less than you thought, and the lesson stays in the log.
To start from your data, you can paste a prompt like this into Claude or ChatGPT.
You're a conversion rate analyst for an Italian small business that sells made-to-measure windows and doors to homeowners in the province of Bergamo. Below are the monthly figures for the last 12 months (visits, leads, quote requests, contracts) and the 20 questions customers most often ask the salesperson before signing. Suggest 8 test hypotheses for the MOFU stage in the format "If we change X for audience Y, metric Z goes up because W". For each hypothesis, name the guardrail metric to watch and the cost to build it (low, medium, high). Drop any hypothesis that's only about cosmetic details.Primary metric and guardrail metric
The primary metric picks the winner. You choose exactly one, before you start. The guardrail metric is the one that mustn’t get worse. On a TOFU landing page, the primary might be visit→lead and the guardrail the share of leads the salesperson rates as qualified.
Segments are worth a look too. A study by Bofei Li of the University of Sydney Business School tested personalized recommendations for three months in an online retail setting. Across 10,350 users randomly split into groups of 5,200 and 5,150, conversion rose from 3.9% to 4.7%, a 20.5% relative lift, with p < 0.01.2 The headline figure on its own doesn’t tell you how each segment behaved. A positive average can hide a segment that didn’t budge. If your revenue depends on repeat customers, that changes the decision.
How many visitors do you need for a reliable test?
It depends on your starting rate and the smallest effect you want to detect. The lower both are, the more visitors you need. With a 2% baseline and an expected 20% lift, you need over 21,000 visitors per version.
The minimum detectable effect is the smallest difference the test has to be able to separate from noise. Setting it at 20% relative means you want to catch 2% turning into 2.4%, and you accept missing 2% turning into 2.1%. The table uses the standard formula for comparing two proportions, at 95% confidence and 80% power.
| Baseline rate | Variant to detect (+20%) | Visitors per version | Total test | Duration at 4,000 visits/month to the page |
|---|---|---|---|---|
| 2% | 2.4% | about 21,100 | about 42,200 | about 10½ months |
| 5% | 6% | about 8,200 | about 16,300 | about 4 months |
| 20% | 24% | about 1,700 | about 3,400 | under a month |
The third row explains why tests on emails, or on pages with high rates, wrap up quickly. The first explains why a button color test on a 4,000-visit site never ends. Even Bofei Li’s study needed three months to gather its data.2
Duration and stopping rule
Run the test for at least one or two full weeks, even if you hit the sample sooner, because the people who visit on a Tuesday aren’t the ones who visit on a Sunday. Write down the end date before you launch. The temptation peaks on day five, when the variant looks 30% ahead and you’re itching to call it. Every time you check the results hoping to stop at the first good sign, you raise the odds of crowning a winner that got there by chance. Put the rule in writing. The test ends on the set date or when the sample is reached, and nobody switches it off before then, barring technical errors.
What to test at each stage of the funnel
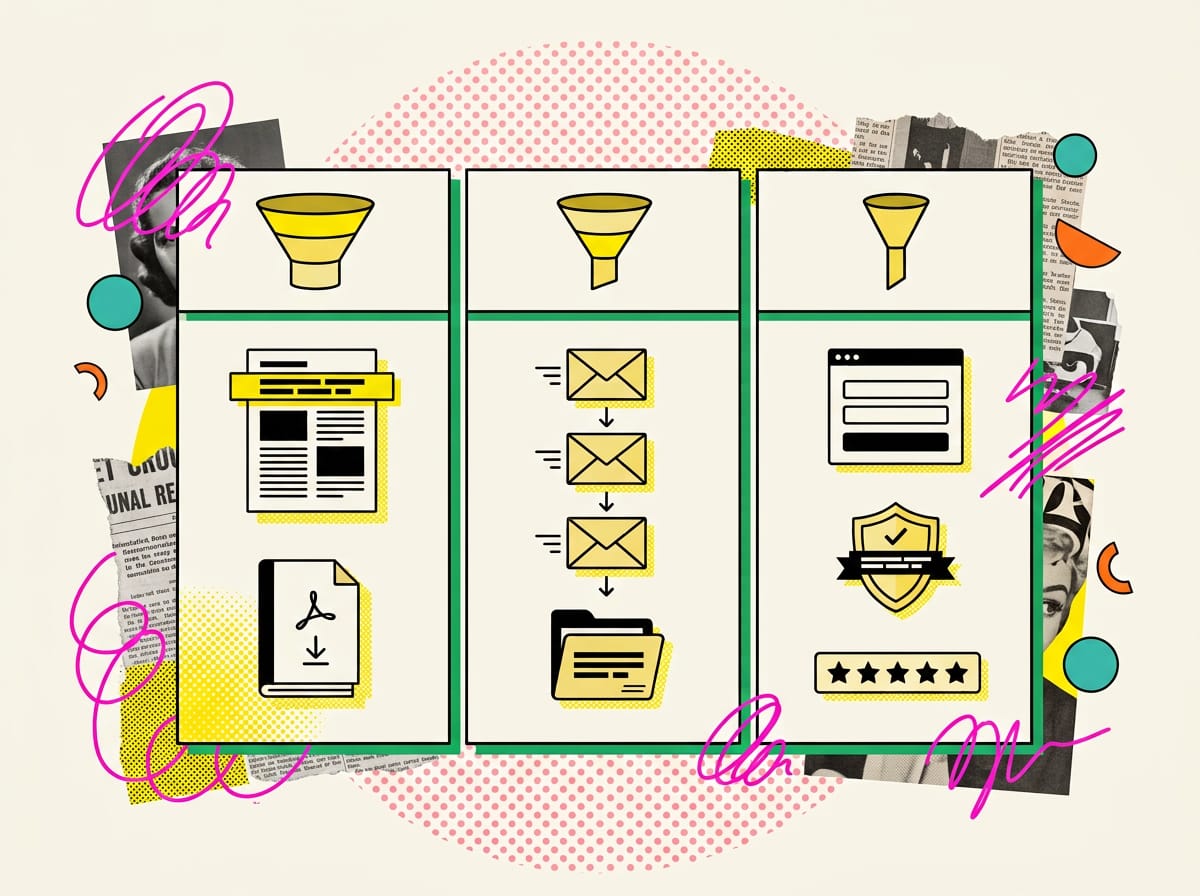
Alex Miller and Kartik Hosanagar of the Wharton School analyzed 2,732 A/B tests run by 252 e-commerce companies across seven industries over three years. They found that price promotions work better early in the funnel, while shipping promotions pay off more on product pages and at checkout.3 Move the same tactic to a different stage and it behaves differently. So each stage gets its own tests and its own metrics.
| Stage | What to test | Primary metric | Guardrail metric |
|---|---|---|---|
| TOFU | article headline and opening; position and format of the CTA to the lead magnet; the lead magnet’s promise | visit → lead | % of leads who open the first email |
| MOFU | subject lines and order of nurture emails; which case study goes in; the invitation to book a call | lead → request | unsubscribes |
| BOFU | layout of the service or quote page; social proof; guarantee; number of form fields | request → customer, or qualified requests | average contract value |
In TOFU, if your traffic comes from awareness keywords, the thing to test is almost always the intro. Someone searching “condensation on windows” wants the answer in the first few lines, and decides right there whether your PDF on choosing new windows is any use to them.
In MOFU the cheapest lever is email, because you already have a list and the site stays as it is. Try two orders for the sequence, one with the case study in the second send and one with it in the fourth.
BOFU tests are few and high-stakes. You pit a written guarantee against none, a 9-field form against a 4-field one, visible ballpark prices against hidden ones. An A/B test on the pricing page hits revenue directly, and it belongs inside a funnel optimization strategy that accounts for your sales cycle.
The best variants come from a theory about how people decide. Three levers from the psychology of persuasion come up again and again, and they should be treated as hypotheses to check. Social proof carries weight in MOFU and BOFU, when the customer’s doubt is “will this work for someone like me?”. Reciprocity drives TOFU, because a genuinely useful lead magnet leaves people feeling they owe you something small. Loss aversion does its work in BOFU, where a guarantee lowers the perceived risk of signing.
When lifting TOFU sinks BOFU
Back to the window company. The team tries an easier landing page. They drop the phone field, make the lead magnet more generic and broaden the promise. Leads jump from 80 to 112, up 40%, and the meeting turns into a celebration. Two months later the salesperson points out that quote requests are still stuck at 20. Lead→request has fallen from 25% to 18%, contracts are still at 8, and they’re spending more hours on the phone with people who only wanted the PDF.
The test won on its own metric, and the P&L stayed flat. Customers per 1,000 visitors were 2 before and 2 after, with more work for sales.
Research on livestream commerce, based on more than 1,500 influencer-hosted streams, draws a distinction that’s useful when you write variants. The amount of product information and positive emotional engagement both increased interest, but only emotional engagement carried people through to purchase.4 The setting is a long way from a small business, yet the lesson travels well. What sparks interest at the top of the funnel can stall before anyone signs at the bottom.
The working rule is to judge every test downstream as well, ideally in customers or revenue per 1,000 visitors. Add a column for it in your test log and fill it in 60-90 days after the test ends, once leads have had time to turn into contracts.
Can you A/B test with little traffic?
Yes, if you take the test to where the volume is and try big changes. With 3,000-4,000 visits a month, a classic comparison on a page converting at 2% takes almost a year. The alternatives below shorten that. Some of them trade away a little rigor to get there, and you should say so openly.
A group of clinical researchers applied A/B testing to the recruitment website for a medical study aimed at older adults. In the first experiment they compared three versions of the landing page (the original and two infographics) across 2,605 visitors.5 Those are small-business numbers, and each version reworked the page’s actual content, well beyond a cosmetic detail.
- Test where you have volume. With a 3,000-contact list on Brevo or Mailchimp you can A/B test a subject line in a single send. On Meta and Google Ads you can run two creatives side by side on a budget of a few hundred euros.
- Use micro-conversions. A click on the CTA or a scroll down to the form, tracked as GA4 events or watched through Microsoft Clarity heatmaps, happens far more often than a quote request and fills the sample faster. The limit is that a click is still just a click. Note that in the log and confirm the result on the real metric as soon as you have the data.
- Test big changes. A page rewritten from scratch or a different offer produces large effects, and large effects need small samples. With the same 2% baseline, if the variant has to lift the rate to 3% (+50%), about 3,800 visitors per version is enough: under two months instead of ten and a half.
- Pool similar pages. If you have six service landing pages built the same way, test the same element on all of them and add up the visitors.
- Compare before and after over equivalent periods. Four weeks against the previous four, or against the same weeks last year, noting seasonality, live campaigns and price changes. It’s the least rigorous method on the list, and the log should flag it that way.
A test SOP you can delegate
A well-run test becomes a method when someone else in the company can repeat it exactly, without having to ask you anything. The whole procedure fits on one page.
- Written hypothesis in the format “If we change X for Y, Z goes up because W”. You approve it in five minutes.
- One primary metric and one guardrail, chosen before launch.
- Sample size calculation using the baseline from your history and the agreed minimum effect, with an online calculator or the formula in Google Sheets. If the test would take more than three months, switch to one of the low-traffic alternatives.
- Start and end dates, with a minimum of two full weeks.
- Stopping rule in writing. The test closes on the date or when the sample is reached, and only a technical error justifies stopping early.
- Analysis of the primary metric, the guardrail and two segments (new vs. returning customers, mobile vs. desktop).
- Updated log with date, stage, hypothesis, metrics, sample, result, decision and what you learned. At 60-90 days, fill in the customers-per-1,000-visitors column.
The log is the part that pays off most over time. Every result you analyze suggests new hypotheses, and each new test starts on firmer ground. After ten tests, your log knows more about your customers than any buyer persona dreamed up in a conference room.
With this SOP, the owner only steps in twice: to approve the hypothesis and to make the final call. A marketing manager or a trained junior can handle everything in between.
How to use AI to speed up testing and analysis
You’ll almost always have more ideas to test than your traffic can verify with enough data. AI makes that list even longer, which is exactly the risk. Use it on the SOP steps where it saves you hours, and keep the decision about what to test for yourself.
Copy variants from the approved hypothesis
Once the hypothesis is signed off, Claude or ChatGPT can write in minutes the variants that would take a copywriter an afternoon.
Write three variants of the block that sits above the form on the quote page of a made-to-measure window and door company in the province of Bergamo. The hypothesis under test is that showing three finished jobs in the visitor's province increases quote requests, because it removes the doubt that the company works too far away. Each variant has a headline of no more than 9 words, two sentences of body copy and a caption for each photo. Direct tone, speak to the reader as "you", no superlatives. Don't touch anything else on the page, so the test measures this change and nothing else.Reading the results
When the test closes, ask the AI to run the numbers and show its working, then check them in Google Sheets. Language models still get arithmetic wrong, and a misplaced decimal point can flip the decision.
Here are the results of an A/B test that closed on its planned date. Version A had 8,240 visitors and 412 leads, version B had 8,190 visitors and 498 leads. The planned sample was 8,200 visitors per version. Calculate the two conversion rates, the relative difference and the p-value using a two-proportion z-test, showing the formula and each step. Then list the conclusions this data does NOT allow me to draw, bearing in mind that we'll only know the guardrail metric (leads qualified by the salesperson) in 60 days.Qualitative reading
Microsoft Clarity records sessions and shows you where in the form visitors give up. If you add an open question after submission (“What almost made you give up?”), you can export the answers and ask Claude to group them by theme, with a count for each. Those themes become the hypotheses for your next test, and the cycle starts again from step one of the SOP.
Where to start this week
Open your CRM and GA4 and rebuild the three rates for the last 12 months in a spreadsheet. Mark the best month for each stage and work out in euros what getting back to that level is worth. Among the stages with enough volume, pick the one worth the most, write a single hypothesis in the SOP format and calculate the sample size. If it needs more than three months, move the test to your email list or to a bigger change. Thirty days from now you’ll have the first result in the log, and one less meeting settled by the HiPPO.
Sources
Footnotes
-
Controlled experiments on the web: survey and practical guide. link.springer.com ↩ ↩2
-
Enhancing Online Conversion Rates through Digital Marketing Interventions Based on A/B Testing: Evidence from a Three-Month Retail Pilot. hbemdata.org ↩ ↩2
-
An Empirical Meta-analysis of E-commerce A/B Testing Strategies. mackinstitute.wharton.upenn.edu ↩
-
EXPRESS: Fan Badges Signal Friendships: How Viewer-Influencer Parasocial Relationship Drives Conversion Funnel in Livestream Commerce. doi.org ↩
-
A/B design testing of a clinical trial recruitment website - PMC. pmc.ncbi.nlm.nih.gov ↩
FAQ
How do you calculate the conversion rate of a TOFU, MOFU and BOFU funnel?
You calculate three stage rates: visit to lead (TOFU), lead to quote request (MOFU) and quote request to customer (BOFU). Your overall conversion rate is the three multiplied together. With 4,000 visits, 80 leads, 20 quote requests and 8 signed contracts, that comes to 0.2%.
Why isn't the overall funnel conversion rate enough?
The overall number tells you something is wrong, but not where. Splitting it into the three stage rates shows which step is losing customers and which one is worth fixing.
Which funnel stage should you fix first?
Start with the stage that has dropped furthest below your best months, as long as it gets enough volume to measure. Because the rates multiply, a 20% gain counts the same at any stage. What decides it is how much you can win back, how much the change costs and how much data you can collect.
Is it better to improve one stage a lot or every stage a little?
Make one bold change at a single stage. A 25% lift at the MOFU stage alone takes you from 8 customers to 10. A 5% lift at two stages only gets you to 8.8.
What data does a small business need to start optimizing its funnel?
You only need the three stage rates, calculated month by month over the last 12 months and always counted the same way. Take visits from Google Analytics 4, and take leads, quote requests and contracts from your CRM.
Why run an A/B test instead of going with the owner's opinion?
Ideas from the owner or the team can make sense, but without a number you can't tell which one actually works. An A/B test checks each change against what real customers do before it becomes the new version of your site.