
TikTok Ads Benchmarks Italy 2026: CPM Data for Small Businesses
Global TikTok CPM averages won't tell you what ads cost in Italy. Read them right, work out cost per customer and build your own benchmark in four weeks.

A business owner reads on some blog that a thousand impressions on TikTok cost a few dollars. They open Ads Manager, upload a video shot in the shop, spend a few hundred euros over a couple of weeks and get a handful of sales. The CPM really was low. What hurt was the cost per customer, and nobody had worked that out for them.
Search for TikTok Ads benchmarks for Italy and you mostly get global averages in dollars, pulled from different samples and often contradicting each other. This piece gives you three things you can actually use. First, how to read those numbers without being misled. Second, the maths that turns a CPM into a cost per acquisition. Third, a four-week plan for building a benchmark of your own, with AI prompts for analysing the reports. For the wider picture across other channels, see the digital advertising benchmark for Italy.
The short version
- Almost every published TikTok CPM average is global and in dollars. Treat them as a ballpark, nothing more.
- Judge the channel on cost per customer. CPM is just the first link in a chain of five metrics.
- Before you launch, check the current minimum budget in the Help Center, in your account’s currency.
- TikTok works best for visual products and younger audiences. High-ticket B2B needs extra checks first.
Who you actually reach with TikTok Ads in Italy
The first benchmark to look at is people, and it comes before price. A small business selling office furniture to 50-year-old procurement managers and one selling fashion accessories to 20-year-olds are effectively on two different platforms, even though they log into the same Ads Manager.
Academic research backs this up. A study published in 2025 in Frontiers in Research looked at more than 500 sponsored ads over 12 months on Meta, TikTok, X and LinkedIn, alongside a survey of 1,200 consumers. It found that TikTok is strong on engagement and lower-funnel conversions, especially with Gen Z, while LinkedIn is still the best channel for high-value B2B leads 1.
There’s also a regulatory factor that matters for planning in 2026. The European Commission has proposed the EU KIDS Act, which bans under-13s from social platforms and sets 15 as the minimum age for a personal account across the EU 2. The Commission has adopted the proposal, though it still has to get through the legislative process. If you sell products aimed at very young buyers, expect that audience to shrink and to come under tighter scrutiny.
So before you talk money, open Ads Manager and set the location, age range and interests of your real customers. Write down the estimated reach the platform gives you. If a travel agency in Bari is after couples aged 35 to 55 within 80 kilometres, that estimate is its first benchmark, and it’s worth more than any national average.
Why published CPMs never agree

Line up five articles on TikTok ad costs and you’ll get five different ranges, because each one is measuring a different sample.
The gaps come down to four methodology choices:
- The sample. A dataset of US e-commerce brands and one that mixes every industry will give you wildly different averages.
- Currency and market. In an auction, price depends on how many advertisers are bidding for the same audience, and competition in the US market looks nothing like competition in Italy.
- Campaign objective. A reach campaign buys cheap impressions. A conversion campaign pays more to put the ad in front of the people most likely to act.
- Timing. During sales seasons and holidays the auction gets crowded and CPMs go up for everyone.
The average CPM you read online describes somebody else’s market. It tells you whether a number is plausible, and that’s about it.
A study of 18 Malaysian SMEs in retail, services and manufacturing shows what happens when you stop at CPM. Many of them used it as their gauge of budget efficiency and sorted it into three bands: low, medium and high 3. That’s exactly the trap the owner in our opening example fell into.
The number that matters: from CPM to cost per customer

CPM only becomes useful as part of a chain. There are five metrics, and each one multiplies or divides the one before it.
- CPM: what you pay per thousand impressions.
- CTR: the share of people who see the ad and click through to your site.
- CPC: the cost of each click. Work it out as CPM divided by (1,000 × CTR).
- CVR: the share of site visitors who buy or leave their details.
- CPA: the cost of each customer or lead. Work it out as CPC divided by CVR.
Below are two hypothetical campaigns for a small business selling natural skincare online. The numbers are illustrative, there to show how the mechanics work.
| Metric | Campaign A | Campaign B |
|---|---|---|
| CPM | €6.00 | €3.00 |
| CTR to site | 0.8% | 0.4% |
| CPC | €0.75 | €0.75 |
| Site CVR | 1.5% | 0.8% |
| CPA | €50.00 | €93.75 |
Campaign B pays half as much for its impressions, yet each customer costs it almost twice as much. That usually happens when the algorithm finds cheap impressions among people who aren’t that interested, or when the video entertains without giving anyone a reason to buy.
One practical detail makes a big difference here. If your report has several click columns, use the one that counts people who landed on your site. Likes, comments and profile visits inflate CTR and make a click look cheap when it isn’t bringing in sales.
Your margin decides what CPA you can afford. If the average first order is worth €70 at a 50% gross margin, a €50 CPA loses you money on the first purchase. That only works if you know the customer will come back and buy again.
What you’re buying on TikTok, Meta and Google
Comparing CPMs across the three platforms tells you very little, because each one sells a different kind of attention. The table sets that out.
| TikTok | Meta (Facebook and Instagram) | Google Search | |
|---|---|---|---|
| What you’re buying | Attention in a feed of vertical videos | Attention in the feed and Stories, with targeting across a very broad audience | Being there at the moment someone searches |
| Where it performs best | Discovery for visual products, younger audiences, impulse buys | Retargeting, lookalike audiences, established e-commerce | Existing demand, local services, B2B with specific searches |
| Where it gets expensive | Complex products that need thinking about | Industries crowded with advertisers | Heavily contested keywords in high-value sectors |
The Frontiers in Research study confirms that each platform performs differently depending on objective and audience 1. If you’re already on Meta, your own numbers are the most reliable starting point for comparison, and you’ll find reference figures in the Meta Ads benchmark.
How much budget a reliable test needs
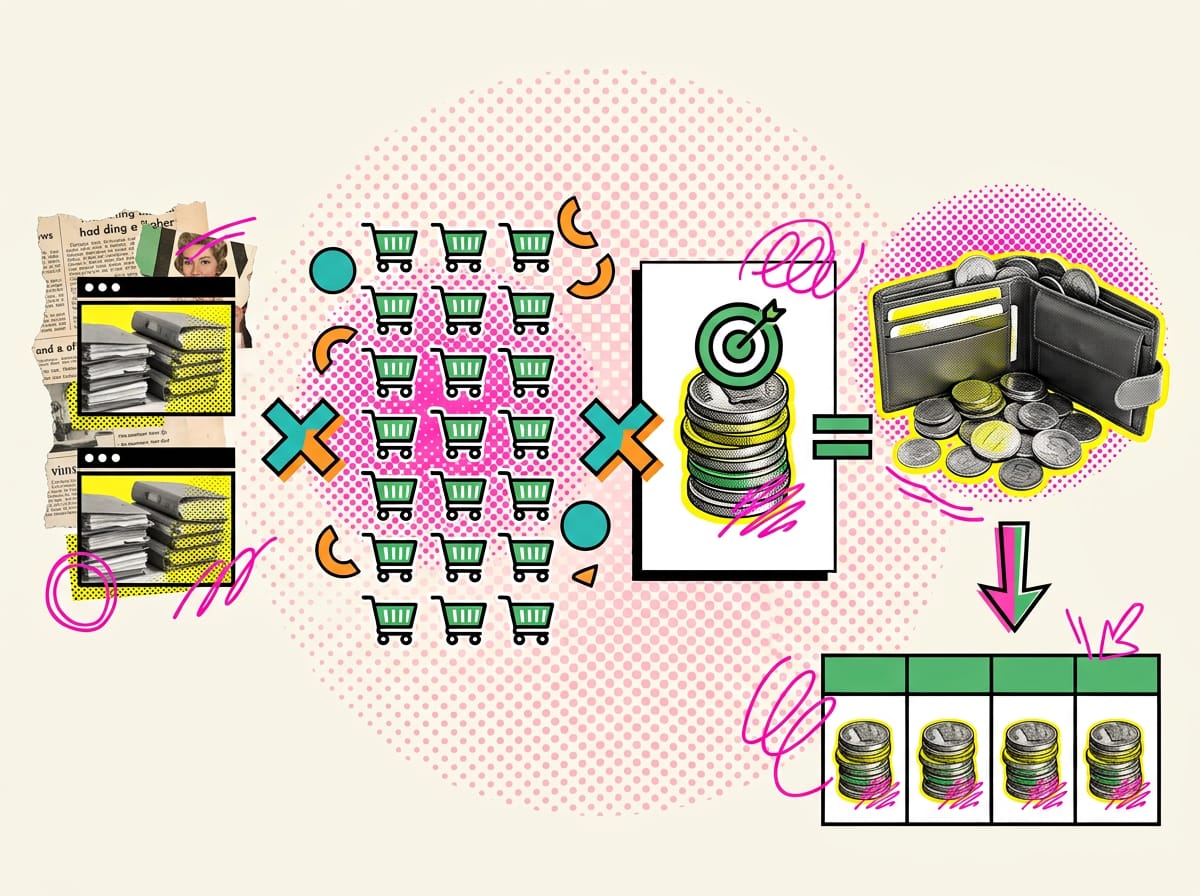
TikTok sets minimum budgets for campaigns, and those thresholds change over time. Before you plan anything, check the current figures in the TikTok for Business Help Center, along with the currency set on your account.
The technical minimum says little about what you should really spend. Work your test budget backwards from your target CPA. A sensible rule is to collect enough conversions per ad group before you judge it, because with too little data luck counts for more than the creative.
Here’s an example. A sports shop in Verona has a target CPA of €40 and wants to test two ad groups at 20 conversions each. The test budget is 2 × 20 × €40 = €1,600, spread over four weeks, which comes to about €57 a day. If that squeezes cash flow, drop to one ad group or pick an intermediate goal such as add-to-cart, which generates more events at a lower cost.
Creative moves CPA more than your industry does
In the chain example, CTR and CVR were what doubled the CPA, and they’re also the metrics the video itself has the most influence over. Research is fairly consistent about what moves them.
The multi-platform study found that, for engagement, authentic creative tends to outperform polished ads, and that targeted, value-led calls to action do the most to drive sales. It also identified one negative factor common to every platform: algorithmic fatigue, the drop-off in response when people see too much of the same kind of content 1.
On the consumer side, a study of 372 Chinese consumers published in Scientific Reports shows that short videos which are useful, easy to follow and entertaining build trust, and trust leads to purchase intent 4. Research on 1,257 Gen Z consumers in Vietnam adds that perceived ad value rises with concrete information, incentives and credibility, while irritation sours people’s attitude to the brand 5. A third study, of 350 short-video users, links purchase intent to how viewers perceive the creator and the values they share with their audience 6.
For a small business, that boils down to some practical calls. An owner who shows how they pack an order, states the price plainly and gives a specific reason to buy this week will usually beat the studio-shot ad. Refresh your creative regularly, before frequency pushes your CPA up. For trends in vertical and shoppable formats, see our analysis of short-form video ads.
Using AI at this stage. Before you shoot, ask Claude or ChatGPT for ten different openings for the same product, then pick the three that sound most believable. Here’s a prompt to start from.
You're a copywriter for 20-30 second vertical videos.
Product: [description, price, typical customer].
Write 10 spoken openings of no more than 2 seconds each, each from a different angle:
a real customer problem, a fact about the product, a demonstration,
a common objection, a before/after.
For each one, give the closing call to action, with a specific benefit and a reason to act now.
No superlatives, no TV-ad lines. Tone: the owner talking to a customer in the shop.
AI speeds up producing the variations, but deciding which ones to test is still your call, based on how your customers actually talk.
E-commerce and lead generation need separate benchmarks
Put a campaign selling a €30 serum and one collecting quote requests for window frames in the same table and the averages mean nothing. The funnels are different, so the CVRs and acceptable CPAs are too.
In e-commerce, the main risk is attribution. The pixel only records the conversions it can track. With long purchase journeys, or when a customer buys later on a different device, some sales simply vanish from the report. Before you switch a campaign off, compare total revenue for the period against your TikTok spend and see whether the overall figure moves with it. Industry reference figures are in the e-commerce benchmark.
In lead generation, the platform CPA is only half the story. An instant form brings in cheap contacts, but they’re often lower quality than leads from a landing page that asks a bit more of people. The metric that matters is cost per qualified lead, or better still cost per customer won, and you only get it by matching Ads Manager data against your CRM.
The research on Malaysian SMEs reaches the same conclusion. Two of the six components it recommends for evaluating digital advertising are funnel diagnostics and integrated measurement, because a single platform’s figures tell you very little about how a campaign is really performing 3.
How to build your own benchmark in four weeks
The benchmark you’ll rely on for the long haul comes from your first few weeks of data. This plan helps you build it properly.
Week 0: set-up. Install the pixel or Events API and check, with a test purchase or enquiry, that the conversion event actually fires. Note down your maximum sustainable CPA, worked out from your margin.
Weeks 1–2: collect data. One conversion objective, one or two ad groups, three creatives per group. Leave the campaigns alone while the data comes in, so the numbers stay comparable.
Week 3: first read. Export the report and fill in the CPM, CTR, CPC, CVR and CPA chain for each creative. Turn off the one with the worst CPA and replace it with a variation of the best.
Week 4: consolidate. Run the same read again. By the end of the month you’ll have five numbers of your own, from an Italian audience and your own product. Next quarter, these are what you measure new results against.
Using AI to read the reports. Export the ad-level CSV from Ads Manager and upload it to Claude or ChatGPT with a prompt like this one.
Attached is a 14-day export from TikTok Ads Manager, one row per ad.
1. For each ad, calculate CPM, CTR to site, CPC, CVR and CPA.
   If there are several click columns, use clicks to destination and tell me which one you used.
2. My maximum sustainable CPA is [X] euros. Flag any ads above that threshold.
3. For each ad above the threshold, identify the weakest link in the chain
   (high CPM, low CTR or low CVR) and where to act: audience, creative or landing page.
4. Flag any ads with fewer than 15 conversions: it's too early to judge those.
Return a table and a list of no more than 5 actions, ranked by impact on CPA.
If you’d rather keep the data in a spreadsheet, three calculated columns in Google Sheets will do it: =CPM/(1000*CTR) for CPC, =CPC/CVR for CPA, plus conditional formatting that turns rows red when they go over your maximum CPA. The weekly check gets a lot quicker.
When do TikTok Ads make sense for a small business?
TikTok Ads make sense for a small business when the product sells itself on screen, the customer is young, the margin can absorb a measured CPA and someone on the team can keep producing new videos. If several of those are missing, the test is likely to burn through budget before it tells you anything readable.
Three real-world cases help you place yourself. A ceramics workshop selling online has visual products, a young audience and stories worth filming, so its odds are good. A tax advisory firm serving businesses is targeting decision-makers who rarely open TikTok with work on their mind, so it’s better off starting with Google or LinkedIn, in line with what the multi-platform research found 1. A restaurant with delivery sits somewhere in between. It can work with tight geotargeting and a clear offer, as long as it measures actual orders rather than views.
The benchmark you need to make the call is the CPA from your first four weeks, set against your margin. The averages you find online are only good for telling you whether that number is plausible.
Fonti
Footnotes
-
Beyond impressions: A multi-platform analysis of social media advertising effectiveness in driving sales and engagement. firjournal.com ↩ ↩2 ↩3 ↩4
-
Shaping Europe’s digital future - European Union. digital-strategy.ec.europa.eu ↩
-
Key Components for Evaluating Paid Digital Advertising (PDA) Performance for SMEs in Malaysia. hrmars.com ↩ ↩2
-
Influence of short video content on consumers purchase … pmc.ncbi.nlm.nih.gov ↩
-
Effects of Advertising Value and Attitude on the Purchase … academia.edu ↩
-
How short video marketing influences purchase intention in … nature.com ↩
FAQ
How much does it cost to advertise on TikTok in Italy?
The CPM averages you find online are almost all global figures in US dollars, so for Italy they only work as a rough order of magnitude. What you actually pay depends on the audience you target, your industry and how much competition there is in the auction. The most reliable way to find out is to measure it with a test campaign on your own audience.
Why do TikTok Ads CPMs vary so much from one source to another?
Each source measures a different sample: different industries, different markets and different currencies. A dataset of US ecommerce brands and one that mixes every industry will produce very different averages. That's why no public average will match what your business ends up paying.
Does a low CPM mean TikTok Ads is worth it?
No. CPM is only the first link in a chain of five metrics that leads to cost per customer. You can pay very little for impressions and still overspend on every sale, so the channel should be judged on customer acquisition cost.
What is the minimum budget for a TikTok Ads campaign?
The minimum budget changes over time and depends on your account currency. Before launching a campaign, check the current figure in the TikTok Ads Help Center, in the currency your account is set up in.
Does TikTok Ads work for B2B companies?
TikTok performs best with visual products and younger audiences, especially at the bottom of the funnel with Gen Z. For high-value B2B leads LinkedIn is still the stronger channel, so on TikTok you need extra testing before committing budget.
How do I build a TikTok Ads benchmark for my own business?
Start in Ads Manager: set the location, age range and interests of your real customer and note the estimated reach. Then run a structured four-week test and use the reports to work out your cost per customer. That data is worth more than any national average.