Customer Lifetime Value for Small Businesses: How to Calculate It
Calculate customer lifetime value for a small business: average order × orders per year × years retained, plus an advanced version with margin and churn.

Two new clients sign in the same month. Each places a first order worth €800. One keeps buying from you for four years. The other vanishes after the first invoice. On January’s P&L they look identical. Six months later one is worth nothing and the other is worth €10,000, and you spent the same budget winning both.
The number that tells them apart before it’s too late is customer lifetime value (CLV): what a customer earns you across the whole relationship, well beyond that first purchase. By the end of this page you’ll have your CLV in a spreadsheet in two versions. The simple one you can build today. The advanced one adds margin and churn. You’ll also know which six lines to check every month and the five levers that actually move the number. If you haven’t worked out your acquisition cost yet, start with the pillar guide on CAC and acquisition metrics and come back here afterwards.
The simple CLV you can calculate today
Customer lifetime value measures how much a customer spends with you from their first purchase to their last 1. It isn’t the same as the value of a single order, or as annual revenue per customer. It’s everything that customer will put in your till for as long as they stay, rolled into one figure you can hold up against what it cost to win them.
The starting formula fits on one line.
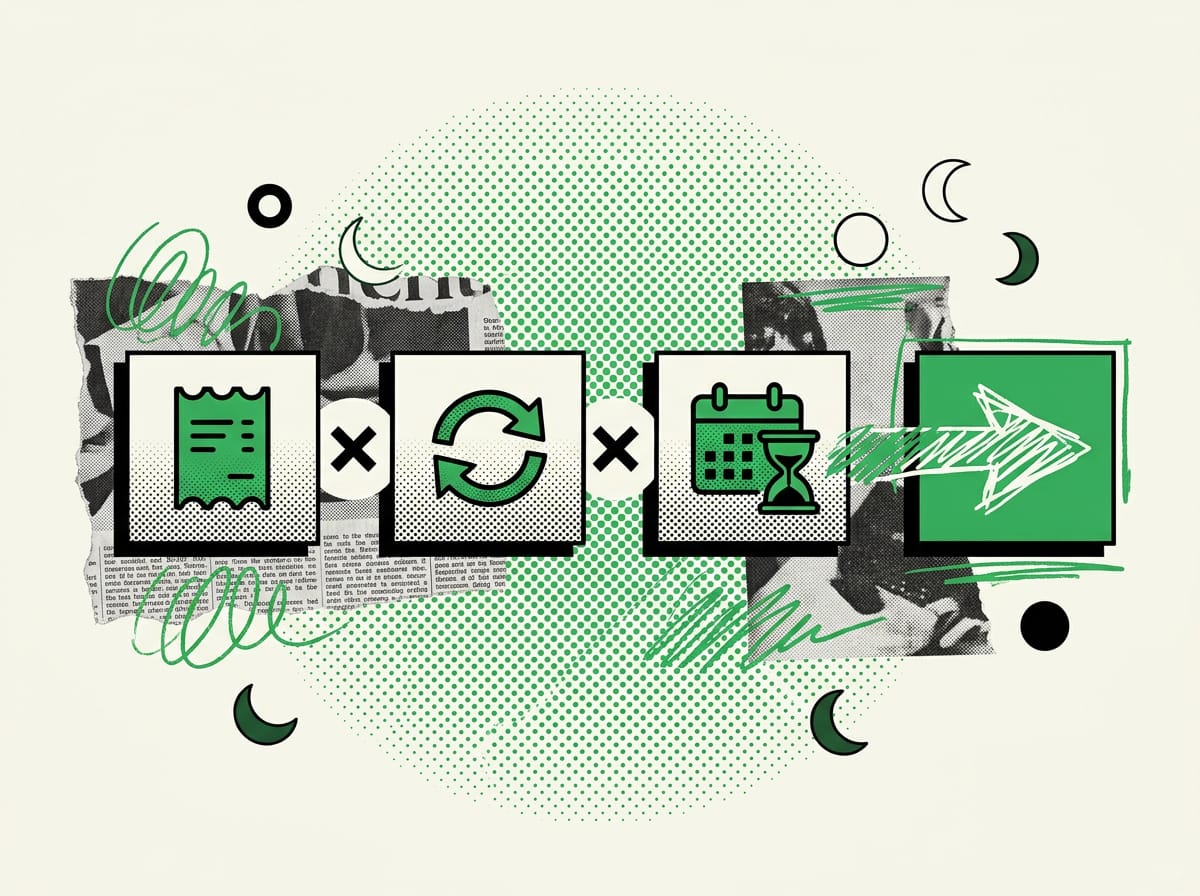
CLV = average order value × orders per year × years as a customer
Wharton puts it as average customer value multiplied by average customer lifespan. With 100 customers spending an average of $100 a year over an average lifespan of 10 years, you get a CLV of $1,000 each 1. The structure is the same. The only difference is that we split annual value into its two parts, order size and frequency, because that’s how a small business actually finds these figures in its accounting software.
The hard part is pulling out those three numbers honestly.
| Variable | Where a small business finds it | Common trap |
|---|---|---|
| Average order value | Invoice ledger or e-commerce export: total revenue divided by number of orders | The average gets inflated if you include customers who only ever bought once |
| Orders per year | CRM, or a count of orders per customer over the last year | One unusual year (a big one-off project) skews typical frequency |
| Years as a customer | Date of first order compared with last order, for customers you’ve already lost | Guessing, and optimistically plugging in 5 or 10 years |
Take a services business with an average order of €1,200, three orders a year and relationships that last four years on average. That’s 1,200 × 3 × 4, or €14,400 in revenue over the customer’s lifetime. Hold on to that figure. The same €14,400 customer follows us through every section below and will change shape twice.
When the simple version is enough, and when it isn’t
This formula will do the job in three situations. It works for deciding how much you can afford to spend acquiring a customer. It works as a first snapshot if you’ve never calculated anything before. And it works if you sell a product or service consistent enough that your customers look broadly alike.
You need the advanced version when you want to compare two different customer segments, when your margin varies a lot from one product line to another, or when you sell subscriptions and churn matters more than average lifespan. In those cases the simple formula hands you a clean, tidy, wrong number.
A word on naming, because it trips up even people who know their metrics. Some sources call the revenue-based figure LTV and the margin-based one CLV. Others use the two interchangeably. In this guide I’ll say “revenue” when I mean revenue and “margin” when I mean margin, so you always know which number you’re holding. If you want to set that €14,400 against your acquisition cost, the working formula is in how to calculate CAC.
Advanced CLV with margin, churn and discount rate
Our €14,400 customer didn’t leave you €14,400. To deliver those services you paid for people, tools and materials. The number that matters when deciding how much to invest in acquisition is margin.
From revenue to contribution margin
Apply your contribution margin to the same example. At a 35% margin, €14,400 of revenue becomes €5,040 of margin over the customer’s lifetime. That’s the figure to compare with CAC, because it’s what actually stays in the business to cover overheads, acquisition and profit. An owner who compares CAC with the €14,400 revenue figure thinks they have three times more room to manoeuvre than they really do, and keeps funding campaigns that are quietly burning cash.
Academic literature defines CLV as exactly this: the present value of the profits a customer generates over the relationship, calculated on margin rather than revenue 2. The revenue-versus-profit distinction has been part of the definition from the start, since Jackson proposed a customer lifetime value based on net present value back in 1985 2.
Churn instead of guessed years
Gut-feel “years as a customer” is the weakest point of the simple calculation. If you have churn data, you can derive that number from a formula rather than eyeballing it.
expected relationship length = 1 ÷ annual churn rate
With 25% annual churn, expected length is 1 ÷ 0.25, which is four years. That’s where the four years in our example came from: a rate, not a hunch.
If you have no analytics and only invoices, estimate churn with the inactivity window method. Decide how many months without a purchase means a customer is effectively gone, then count how many of your customers have crossed that line. The right window depends on the natural rhythm of your business.
| Typical repurchase rhythm | Inactivity window after which the customer is lost |
|---|---|
| Monthly (consumables, recurring services) | 2-3 months without an order |
| Quarterly (supplies, maintenance) | 6-8 months without an order |
| Annual (renewals, seasonal services) | 15-18 months without an order |
Divide the customers past the threshold by your total and you have a churn estimate built from invoices alone, with no CRM and no tracking tools.
The formula with retention and discount rate
Once relationships stretch past three or four years, a euro collected five years from now is worth less than a euro collected today, so it pays to discount it. The formula becomes:
CLV = margin per period × retention ÷ (1 + discount rate − retention)
Margin per period is what the customer leaves you in a year after variable costs. Retention is the share of customers who stay from one year to the next, i.e. 1 minus churn, so with 25% churn retention is 0.75. The discount rate is the cost of money over time: how much you mark down future income.
The discount rate, and when you actually need it
Most guides either ignore the discount rate or apply it everywhere, and they get it wrong in opposite directions. For a small business the rule of thumb is simpler. If your relationships last one or two years, skip the discount rate: discounting income that close in time shifts the result by a few tens of euros and clutters your spreadsheet for nothing. If you sell subscriptions, or your customers stay five, eight, ten years, the discount rate stops being a detail. You’re adding up income spread far into the future, and without discounting it you’ll overstate its value.
A warning from the empirical research: a long relationship doesn’t automatically mean a profitable one. Long-standing customers aren’t necessarily the most profitable, as research on long-life customers in non-contractual settings has shown (Reinartz and Kumar, Journal of Marketing, 2000) 3. A customer who stays ten years, buys little and needs a lot of support can be worth less than one who stays two years and places big orders. Margin-based CLV is how you catch these cases.
The same calculation across three business models

The formula stays the same. What changes is which variables you have to hand and which one carries the most weight. Below are the three typical small-business models side by side, with the same method applied to different numbers.
| Model | Key variable | Worked example | Margin-based CLV |
|---|---|---|---|
| B2B services | Relationship length and order size | €1,200 × 3 orders × 4 years = €14,400 revenue, 35% margin | ~€5,040 |
| E-commerce | Repurchase frequency and basket size | €60 basket × 4 purchases/year × 2.5 years = €600 revenue, 45% margin | ~€270 |
| SaaS / subscription | Monthly churn and recurring margin | €49/month, 4% monthly churn, 25-month lifespan = €1,225 revenue, 80% margin | ~€980 |
In B2B services, value is built on relationship length and the size of each job, and customers are few enough to know by name. In e-commerce there are lots of customers and the game is played on repurchase frequency and average basket. In SaaS, churn rules everything. At 4% monthly churn, expected lifespan is 1 ÷ 0.04, roughly 25 months, and every point of churn you shave off adds noticeably to a customer’s life. Notice that the model with the lowest revenue, e-commerce, can still post a competitive margin-based CLV thanks to a high percentage margin. That’s exactly why reasoning on revenue alone misleads you.
To work out which of these models best describes your customer base, look at how often customers come back to buy and how much recurring margin weighs against the single order.
Five levers to grow CLV
CLV is a number you can work on. Every part of the formula is a lever you can pull, and Wharton boils them down to concrete moves, from order size through to purchase frequency 1. Here are the five levers, ranked by impact, with what each one means in practice.
| Lever | What it moves | Practical move for a small business | Impact |
|---|---|---|---|
| Raise average order value | Average order value | Upsell at checkout, premium versions, relevant add-on services | High |
| Increase repurchase frequency | Orders per year | Reorder reminders, annual contracts, offers on new or limited editions | High |
| Reduce churn | Retention / lifespan | Careful onboarding, proactive contact before the inactivity window closes | Very high |
| Improve margin | Margin per period | Review pricing, cut variable delivery costs, drop loss-making customers | Medium-high |
| Sell to existing customers | Frequency and order size | Cross-sell to people who already know you, rather than only chasing new leads | High |
That last lever deserves a number, because it turns the way many small businesses allocate budget on its head. Acquiring a new customer costs six to seven times more than keeping an existing one, and a 5% increase in retention can lift profitability by 25% or more, close to doubling it 1. The odds of selling to a customer who already knows you can be up to 14 times higher than closing a cold lead 1. If your entire marketing budget goes on acquisition and none on retention, CLV is showing you where the money leaks.
The CLV dashboard to check every month
A CLV calculated once and filed away is dead on arrival. The real value comes from keeping an eye on it with a handful of lines, every month, and reacting when one of them moves the wrong way. These six are all you need.
- Average margin-based CLV, recalculated on a rolling twelve months. Alarm threshold: if it drops two months running, something has broken upstream.
- Churn for the period: customers lost over total active customers. When it climbs above your historical average, find out straight away which segments you’re losing.
- Average order value, to catch price erosion or runaway discounting before it eats your margin.
- Repurchase frequency: orders per active customer. If it falls, customers are buying less often before they disappear altogether.
- CLV to CAC ratio, your sustainability check on acquisition. Below a certain threshold you’re buying customers who never pay back.
- Customers inside the inactivity window: the ones at risk of churning that you can still win back if you move now.
On cadence: track average CLV and churn monthly, and review margins and thresholds quarterly. For a business turning over €1–1.5M, this dashboard is plenty, as long as someone actually looks at it and acts on whichever line is moving.
Calculating and segmenting CLV with AI
AI speeds up a calculation you already need to know how to set up yourself. The process is the one from the sections above. What AI saves you is the hours in a spreadsheet when you’re starting from a raw sales export. The academic research backs this up: measuring customer value in non-contractual settings now relies on probabilistic models such as Pareto/NBD and on machine learning algorithms that pick out purchasing patterns hidden in the data 2. You can apply the same logic with a spreadsheet and a good prompt.
Export a file from your accounting software or e-commerce platform with at least three columns: customer ID, order date and amount. Then load it into a model that can work with data (Claude or ChatGPT with file analysis switched on, or an Excel or Google Sheets formula built with AI help) and use a prompt like this:
“I have a sales export with the columns customer ID, order date, amount. For each customer, calculate the average order value, the number of orders per year and the months between first and last order. Then calculate revenue-based CLV as average order value times orders per year times years as a customer. Apply a 35% margin to get margin-based CLV. Exclude customers with only one order from the average order value calculation and list them separately. Return a table sorted by margin-based CLV, highest first.”
For segmentation, which is where AI saves you the most time, add a second prompt:
“Split customers into three groups by margin-based CLV: high (top 20%), medium (next 30%), low (remaining 50%). For each group give me average CLV, average purchase frequency and average months as a customer. Flag which customers in the high group haven’t bought anything in over 12 months, so I know who to call first.”
A few minutes later you have a list of your best customers at risk of leaving: line six of the dashboard, filled in automatically. The RFM model behind this segmentation, based on recency, frequency and monetary value, has been in the literature since the 1990s 2, and today you can rebuild it with a prompt instead of a data-mining project. The right process is still yours to own. AI just takes the manual hours off your plate.
Further reading
- LTV/CAC ratio: the key ratio for sustainable acquisition
- CAC payback period: how long it takes to recover your investment
Sources
Footnotes
-
Customer Lifetime Value: What It Is and Why It Matters - Wharton. executiveeducation.wharton.upenn.edu ↩ ↩2 ↩3 ↩4 ↩5
-
Research on customer lifetime value based on machine … pmc.ncbi.nlm.nih.gov ↩ ↩2 ↩3 ↩4
-
On the profitability of long-life customers in a noncontractual setting: An empirical investigation and implications for marketing. researchgate.net ↩
FAQ
How do you calculate customer lifetime value for a small business?
In the simple version, multiply average order value by the number of orders per year and by the number of years the customer stays. For example, €1,200 × 3 orders × 4 years gives €14,400 in revenue over the customer's lifetime.
Where do I find the data to calculate CLV?
Get average order value from your invoice log or e-commerce export, and orders per year from your CRM or a count of orders per customer. For years retained, compare the first and last order dates of customers you've already lost.
What's the difference between simple and advanced CLV?
Simple CLV uses only order value, purchase frequency and retention time. It works for a first snapshot or when your customers are fairly similar. Advanced CLV adds profit margin and churn, and you need it when comparing segments, when margins vary a lot, or when you sell subscriptions.
When is the simple CLV formula good enough?
It's enough to decide how much you can spend to acquire a customer, to get a first baseline if you've never measured CLV, and when your products or services are uniform enough that your customers look alike.
Why do two customers with the same first order have different CLVs?
A first purchase doesn't tell you how long the relationship will last. One customer might keep buying for years while the other disappears after the first invoice. CLV tells them apart before you spend the same acquisition budget on both.
Why compare CLV with customer acquisition cost?
It shows whether you're spending less to win customers than they'll bring in over time. If you don't know your customer acquisition cost (CAC) yet, calculate it first, then compare it with your CLV.